Coastal Sea-Ice Break-Up Events in Beringia
Samuel Aucoin
Department of Atmospheric and Oceanic Sciences, McGill University, Montreal, QC, Canada
Bruno Tremblay
Department of Atmospheric and Oceanic Sciences, McGill University, Montreal, QC, Canada and Lamont-Doherty Earth Observatory, Columbia University, Palisades, NY, USA
Robert Newton
Lamont-Doherty Earth Observatory, Columbia University, Palisades, NY, USA
Abstract
We quantify changes in break‐up events of landfast ice in the transition from a perennial to a seasonal sea ice cover in the Arctic. A break‐up event is defined as a time when coastal sea ice concentration drops below 95% after a minimum period of 10 days of stable ice conditions. To this end we analyze output diagnostics from the Community Earth System Model (Version 1) – Large Ensemble from 1920 to 2080, focusing on six coastal communities of Alaska, Chukotka, and the Kamtchatka Peninsula: Utqiaġvik, Point Hope, Gambell, Novoye Chaplino, Sireniki, and Pakhachi. Model results generally agree with the satellite record with open water formation along the coastline associated with sustained offshore winds, although the sensitivity of CESM1‐LE is higher than that of observations due to the absence of a landfast ice parameterization in CESM1‐ LE. Specifically, we see a linear relationship between the magnitude of the opening and offshore surface wind stresses integrated over the 10 days prior to the opening event, (p‐value < 0.01). While the break‐up event frequency increases (5.53 × 10⁻⁵ events/day/year for Utqiagvik) in the 21st century due to the thinning, or weakening, of the landfast ice cover, the total number of winter break‐up events decreases due to a shortening of the winter season (mean of ‐5.3 days/decade).
Introduction
The Arctic is home to approximately 4 million inhabitants1, spread out across seven countries. Landfast ice, defined as sea ice that is fastened to the shore or ocean floor, is an important part of Arctic coastal ecosystems2. Arctic communities often depend upon local landfast ice for daily activities such as hunting and fishing3>, transportation, and recreational activities and thus have an intimate relationship with sea ice. While large‐scale mean changes in Arctic sea ice have been studied extensively (e.g.4–8 etc.), of more immediate use and concern to local peoples9 are small‐scale spatial and temporal changes, which have received less attention. Understanding the changes in the stability and predictability of landfast ice for instance10. The Arctic has had perennial ice cover since at least the mid Holocene Climactic Optimum11, and is expected to transition to seasonal cover before the mid 21st century4,5. It is therefore important to better understand this transition, which is likely too rapid for local communities to adapt to without severe social and economic stress.
Despite its name, landfast ice is very much a dynamic system, and understanding those dynamics is key to ensuring the safety and well‐being of those who depend on it. In this study, we investigate break‐up events10,12–14, which is the phenomenon where a portion of landfast ice breaks away from the coast during winter, forming an area of open water, followed by the closing of the pack ice several days later. These events are important to understand because they can create unsafe conditions for residents engaging in activities on the landfast ice, including becoming stranded on ice that has become a drifting floe. There has been some previous work investigating break‐up events, sometimes named breakout events, but much of this work has either been focused on spring break‐up rather than mid‐winter events (e.g.15,16), or single events10,12–14, and mostly using a qualitative definition. While these studies characterized the general mechanisms behind break‐up events such as wind forcing, ocean currents, and sea level change among other things, the overall understanding is by no means comprehensive. There has not been a study with the same goals as ours: exploring the use of models to study break‐up events, and investigating future trends.
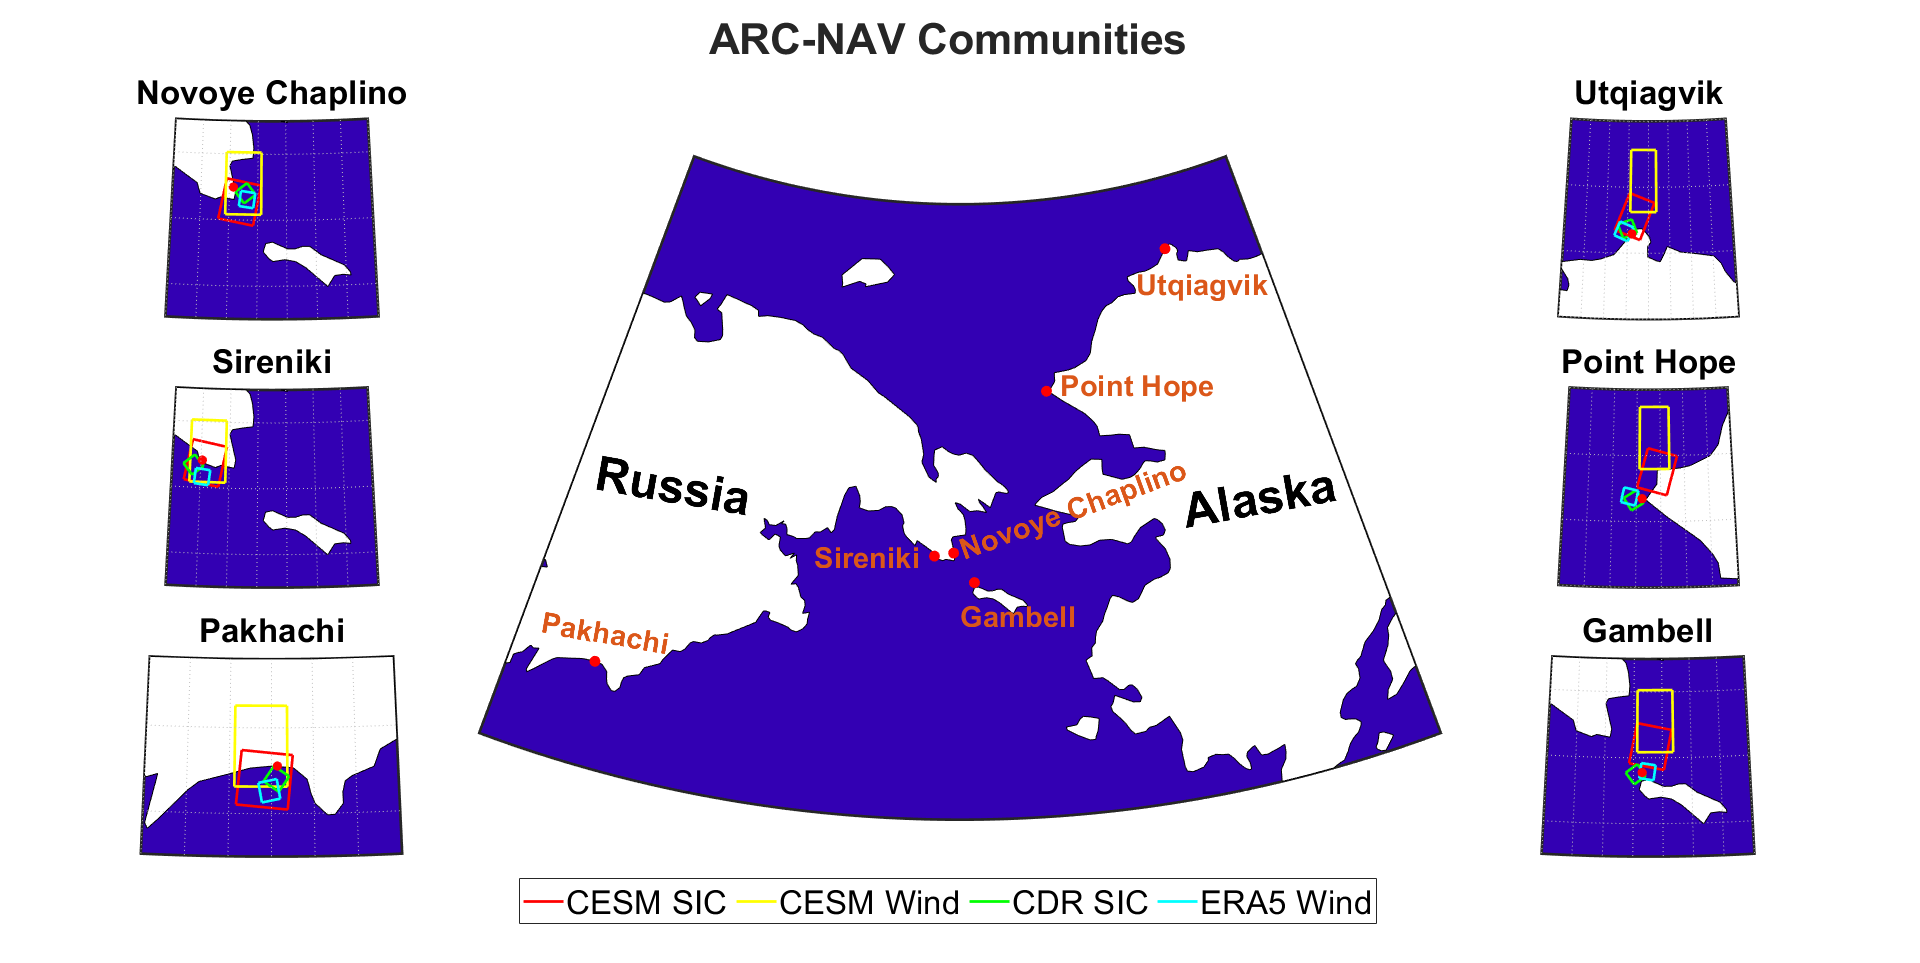
Few communities have local landfast ice monitoring systems in place (e.g.Utqiagvik, Alaska10), but such monitoring systems do not provide information on future events or trends. In this study we look at decadal projections in the number of break‐up events in coastal communities of Beringia (see Fig. 1), and at physical mechanisms responsible for break‐up events. Models are an invaluable tool in climate science since they allow us to predict future trends, but some argue that the results involving landfast ice should be interpreted with caution17,18 as landfast ice is difficult to model. However, since ground and satellite data on landfast ice is severely limited in terms of both spatial and temporal scale, the use of models is important to understand this phenomenon.
To this end, we analyse changes in simulated sea ice concentrations from the Community Earth System Model (Version 1) – Large Ensemble (CESM1‐LE) and passive microwave observations.
Data
Passive Microwave Data
We use daily sea ice concentration (SIC) data from the NOAA/NSIDC Climate Data Record of Passive Microwave Sea Ice Concentration (CDR), Version 419. The CDR database is based on the SICs from both the NASA Team algorithm20, and the NASA Bootstrap algorithm21. The database uses the NSIDC Polar Stereographic projection, which has a spatial resolution of 25 km × 25 km, and provides nearly continuous daily SIC estimates from October 25, 1978 to December 31, 2020. In the following, we omit 1978 and 2020 to have only complete years, and to be temporally consistent with ERA5 winds. Specific grid cells adjacent to the coast are chosen for analysis. We also use daily 10 m wind components from the European Centre for Medium‐Range Weather Forecasts (ECMWF) Reanalysis 5th Generation (ERA5)22. ERA5 reanalysis, published by the ECMWF, provides hourly estimates of many Earth system components. We use 10 m wind components from the ECMWF ERA5 reanalysis interpolated on the Equal‐Area Scalable Earth (EASE) Grid, at a spatial resolution of 25 km × 25 km. Grid cells located nearest to those chosen from the CDR dataset are used for analysis.
CESM1‐LE
We use daily sea ice concentration, radiative surface temperature, and surface wind diagnostics from the Community Earth System Model Large Ensemble (CESM1‐LE)23. CESM1‐LE uses a rotated grid that puts the North Pole over Greenland with a nominal 1‐degree latitude and longitude spatial resolution for the ocean and ice components. The atmospheric grid uses a standard spherical polar grid, also with a nominal 1‐degree latitude and longitude spatial resolution. In this latitude band, 1‐degree equates to approximately 50‐100 km, which is large compared to a typical landfast ice extent in this region of approximately 20 km24, but still comparable. CESM1‐LE is comprised of 5 individual components (atmosphere, ocean, land, sea ice, runoff), and a coupler to transfer the variables between the atmospheric and ocean/ice components. The model does not resolve, nor does it have a parameterization of, landfast ice, which makes the ice more susceptible to dynamical forcings, and is therefore less representative of reality. CESM1‐LE has 40 ensemble members, each starting with slightly differing initial atmospheric conditions. For this study, only one Ensemble Member (EM2) is analyzed, from January 1, 1920, to December 31, 2080. The results are robust to the exact choice of member. All ensemble members are forced with historical carbon dioxide (CO2) emissions up to 2005, then follow the Representative Concentration Pathway 8.5 (RCP8.5) emissions scenario to the end of the simulation. RCP8.5 represents the scenario where current trends in population and economic growth continue in an absence of climate change policies, and has the highest greenhouse gas emissions of the RCPs25.
Methodology
The analysis is conducted for communities in the Beringia region which are study sites of the Arctic Robust Communities Navigating Adaption to Variability (ARCNAV) project (see Fig. 1). These include three communities in Alaska (USA) and three communities on the Kamchatka Peninsula (Russia): Utqiagvik (AK), Point Hope (AK), Gambell (AK), Novoye Chaplino (RU), Sireniki (RU), and Pakhachi (RU).
We identify the closest grid cell of each data set to each community’s location to complete our landfast ice analysis (see Fig. 1). The grid cells from each of the CESM1‐LE sea ice and atmosphere components are chosen to most closely match each other geographically, and likewise for the CDR and ERA5 datasets. Each grid cell is chosen based on its latitudinal and longitudinal proximity to its corresponding community in combination with minimal overlap with the land.
We define the start of the freeze season as the first day of a series of 10 days with a daily mean greater than 95% SIC and the start of the melt season as the first day of a series of 30 consecutive days with SIC below 95%. For some southern communities, these conditions are no longer met later in the 21st century, and the length of the winter season is set to zero. We define a break‐up event as a period of at least 2 days with a mean SIC below 95%, following a period of 10 days with a mean SIC above 95%. We consider a 10‐day period with a mean SIC ≥95% as a stable ice cover. Since a break‐up event can last multiple days using this definition (up until the stability condition is no longer met), the date on which the SIC of the event reaches a minimum is used for date‐specific analysis. We choose a 95% SIC threshold for a break‐up event because higher thresholds will trigger too many false events due to noise in the signal, and lower thresholds will fail to capture smaller‐magnitude events. The exact number chosen is somewhat arbitrary, but thresholds in the range of 90%‐98% show similar results (not shown). A different threshold may impact the number and average magnitude of events, but likely would not have a major effect on the qualitative properties of the observed trends. We therefore choose 95% SIC as our threshold, understanding that the trends are more important than exact values in this analysis.
Results and Discussion
Historical Record
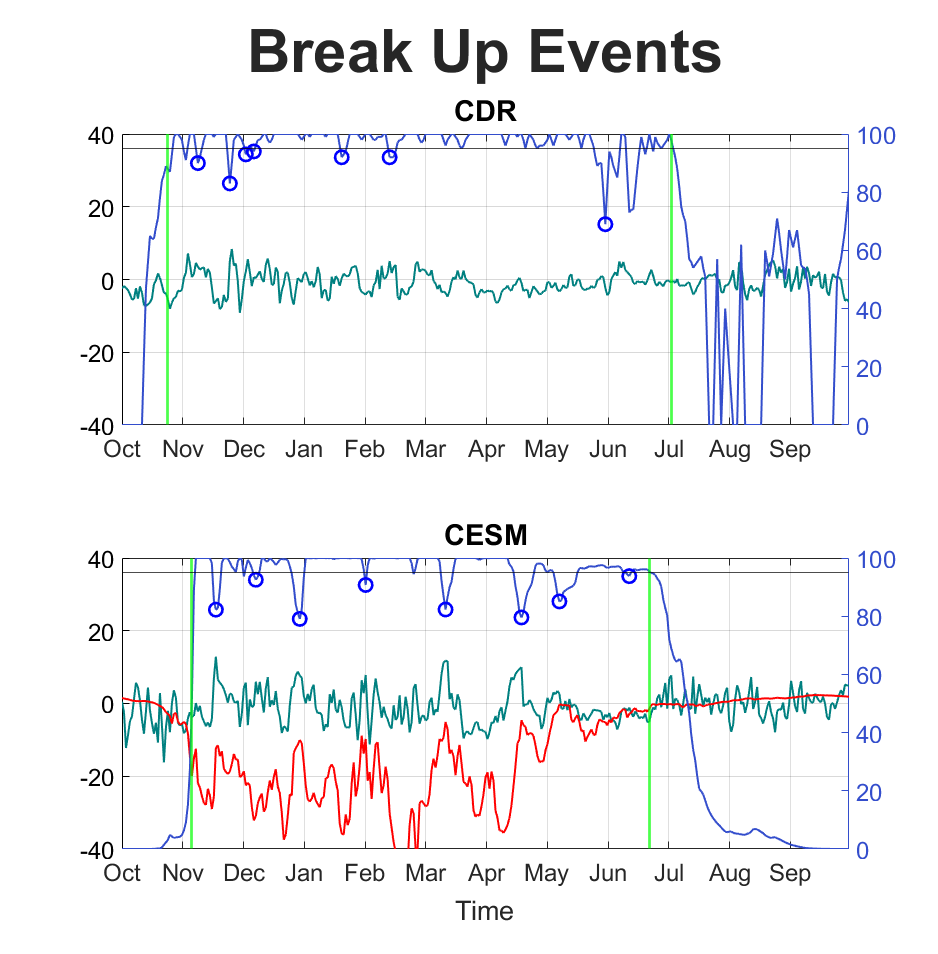
We describe the general behaviour of the landfast ice cover and break‐up events for a typical year in the mid 20th century in Utqiagvik (Fig. 2). The other communities follow the same pattern with the exception of Pakhachi, where winter sea ice cover rarely reaches stability. A qualitative analysis shows that most break‐up events are preceded by a large spike in both wind speed perpendicular to the coastline, (meridional in Utqiagvik’s case) and temperature.
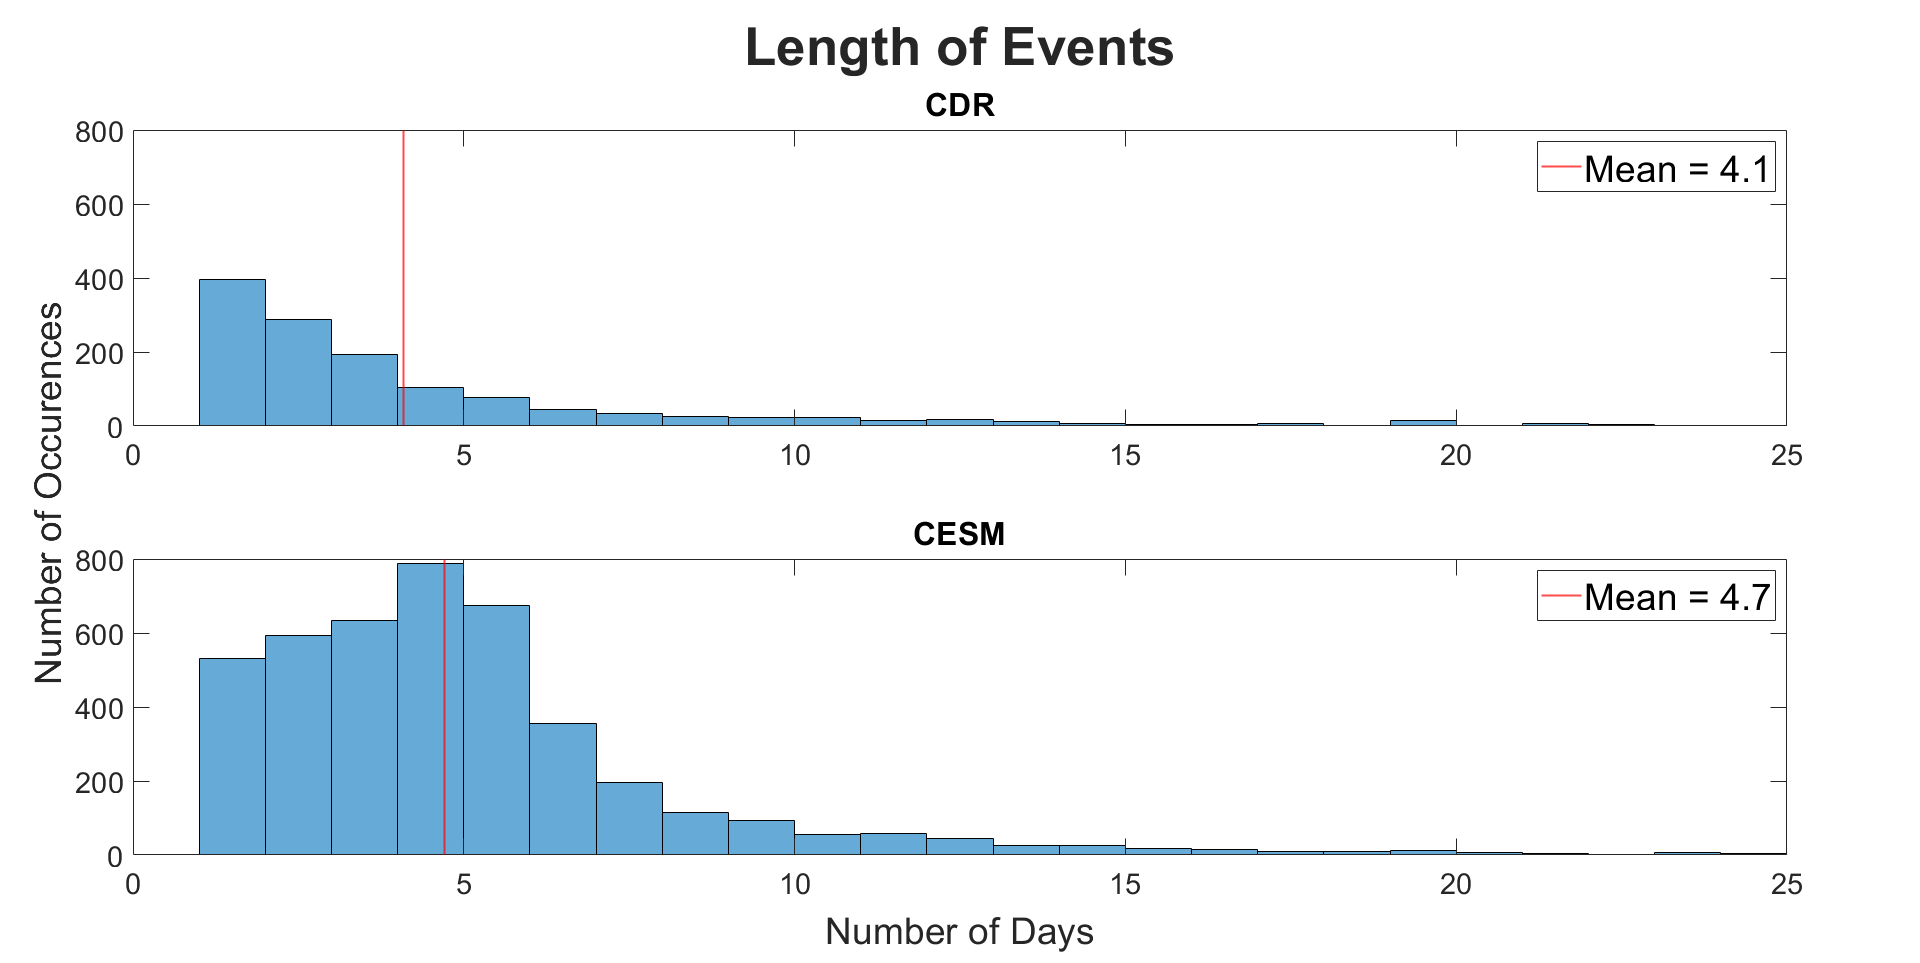
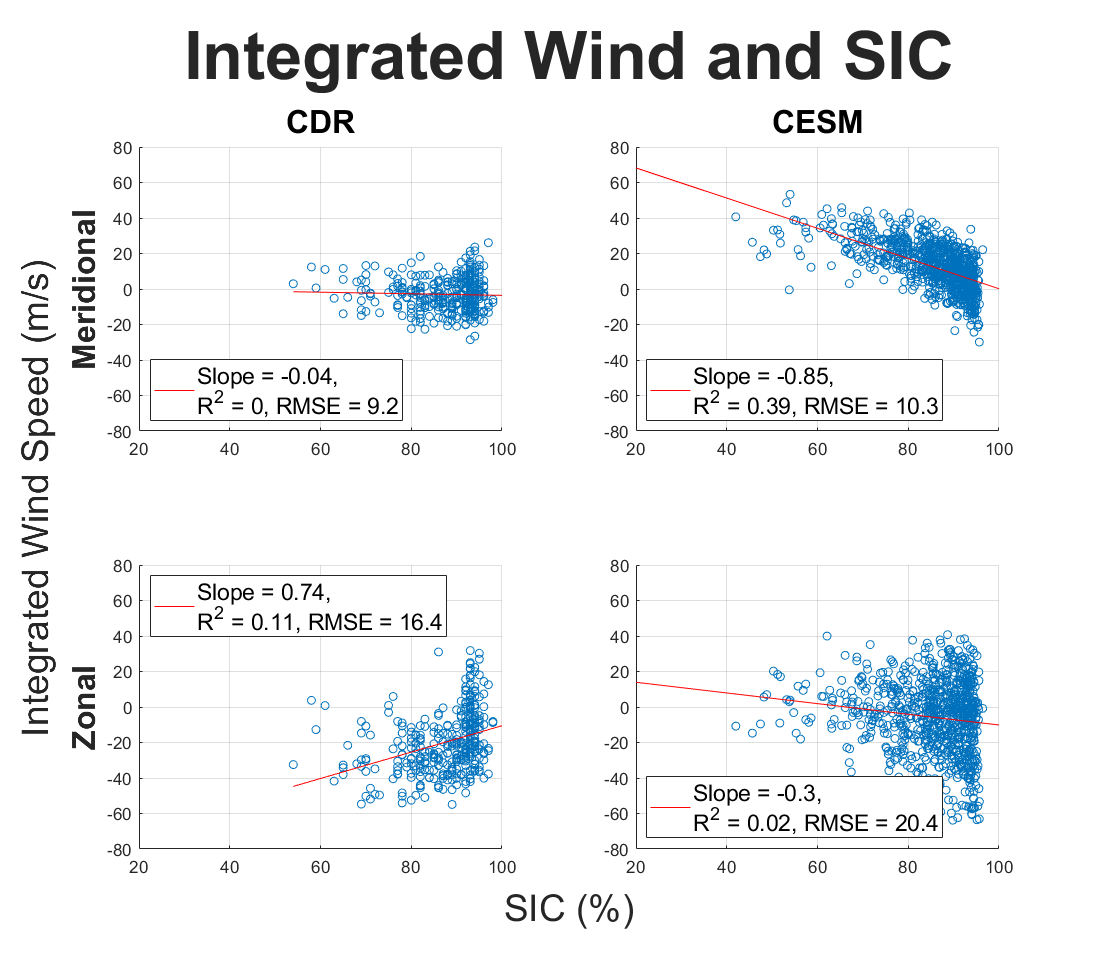
While temperature is not explored further due to relative unimportance compared to wind forcing and lack of observational data, the relationship observed in Fig. 2 is explained by further analysis; Both CESM1‐LE and CDR observations indicate that they often last a period of 3‐10 days (see Fig. 3). The magnitude of a break‐up event is weakly correlated with the 4‐day integrated off‐shore wind (max. r2 ≈ 0.3)(see Fig. 4) and the three to ten day timescale of break‐up events points toward synoptic‐scale (O ~ 1000 km) weather phenomena, such as storms, that bring strong winds and relatively warm temperatures from the south. We infer that atmospheric forcings, specifically storms situated in a geographical position to apply off‐shore wind stress, play an important role in causing and modulating the strength of break‐up events.
The model and satellite observations, however, do not always agree on the nature of the correlation (see Fig. 4). For instance, meridional (southerly) and zonal (easterly) wind anomalies have the largest impact on the magnitude of break‐up events in Utqiagvik in the model and observations, respectively. In CESM1‐LE, the sandspit on which Utqiagvik is located is not resolved, and the hamlet faces directly north to the Arctic Ocean, whereas in reality it faces north‐west. All other communities considered, except Pakhachi, are located on geographical features (e.g. a peninsula) that are not resolved in the model For example, Gambell is on an island that does not exist in CESM1‐LE (i.e. Gambell is in open water instead of on land). In observations (Fig. 4), we find a wide range of zonal wind velocities for SIC ≈ 95% (i.e. near‐stable landfast ice), reflecting differences in the internal ice stress and the presence of anchor points on the ocean floor on the shallow shelf12. In CESM1‐LE, however, we see a much tighter SIC‐meridional wind relationship even at near‐stable SIC. This is likely due to the fact that CESM1‐LE does not have a landfast ice parameterization (e.g. 26), which causes it to be more susceptible to changes in wind forcing since there is no frictional force keeping the ice attached to shore, as well as a possible underestimation ice thickness near the shore due to a lack of an anchor point.
The addition of such a parameter, such as the one presented in 26, would improve the model’s representation of reality, and would likely reduce both the number and magnitude of events observed in this study. Moreover, there is uncertainty associated with SIC measurements from passive microwave satellites near the coast due to land contamination27, where satellite have difficulty differentiating between sea ice and land snow. For this analysis we accepted that uncertainty since passive microwave satellite measurements are still the most consistent data source for SIC. ERA5 wind components have also been shown to be less reliable near coastlines, due mainly to the differences in surface roughness and solar irradiation28.
ERA5 is, as well, less reliable in areas of heterogeneous topography28, which could affect our results in Novoye Chaplino, Sireniki, and Pakhachi, as they are located near mountain ranges. Despite this, ERA5 has been found to usable in Europe29 and the South China Sea30, so we therefore believe ERA5 reasonably represents meteorological conditions in Beringia, within a degree of uncertainty.
Additionally, there could be an introduction of errors from downscaling the 1‐degree model resolution for use at these locations, as the resolution is larger than the phenomena. For example, a break‐up event could be detected in CESM1‐LE that occurs far enough offshore to no longer be considered landfast ice. As a consequence of this, we expect CESM1‐LE to overestimate break‐up events. Despite these caveats, we find that CESM1‐LE generally represents observed break‐up events statistically well in terms of number, magnitude, length, frequency, and mechanisms of events. Based on these findings, we use CESM1‐LE to predict long‐term trends in break‐up events.
Projections
The number of break‐up events in a season can be impacted by two opposing effects. The first effect is the shortening of the winter season, which reduces the number of break‐up events by limiting the amount of time to produce them. The second effect is the thinning of the ice cover, which reduces the ice strength and increases the probability of a break‐up event for a given wind forcing. Results show a negative trend in the mean number of break‐up events per winter for all locations in both CDR (not significant) and CESM1‐LE (p‐value < 0.01) (see Fig. 5 A.). The negative trend is primarily the result of the decrease in the length of the winter season (see Fig. 6) as opposed to an increase in the time between events (results not shown).
In Utqiagvik and Point Hope, the model predicts a stable landfast ice cover being present until the end of the 21st century, contrary to the other four locations, in which the landfast ice cover becomes too unstable to meet our defined criteria at some point in the 21st century (see Fig. 6). In Gambell, Novoye Chaplino, Sireniki, and Pakhachi, we already see a complete absence of stable landfast ice cover, meaning no freeze date is identified, in the satellite record in 1, 2, 4, and 14 years at each location respectively. This is in accordance with the observational record which shows signs of a transition to a more unstable landfast ice coverage6,7,31. Primarily, the absence of a stable ice cover occurs late in the observational record (approximately 2015‐2019). Whether this is due to long‐term variability, or a trend, cannot be inferred from the short record. Nonetheless, it is consistent with model results.
The dominant effect changing the number of break‐up events over the course of a winter (shortening of season versus thinning ice cover) depends on location (see Fig. 5 B.). In both the satellite observations and the model simulation, the more northern locations with a stable landfast ice regime (Utqiagvik and Point Hope) show almost no correlation between the number of events and the length of season; the more southern locations show a significant correlation with the length of the winter season. In CESM1‐LE, we observe that Utqiagvik and Point Hope have positive slopes for break‐up event frequency, which can be interpreted as 1 event every x days during the winter season (expressed in events per day per year), while Gambell, Novoye Chaplino, and Sireniki have negative slopes (all p‐values < 0.01 and mean across 6 locations of −5.80 × 10⁻⁵ events/day/year, p‐value < 0.01) (results not shown). All locations have decreasing season length (mean of −5.3 days/decade). The combination of these two measures results in negative slopes at all locations for break‐up events per year (all p‐values < 0.01, mean of −0.020 events/year). In the CDR, we observe that Utqiagvik (p‐value < 0.01), Point Hope (not significant), and Novoye Chaplino (p‐value < 0.01) have positive slopes for break‐up event frequency, Sireniki has a negative slope (p‐value < 0.01), and Gambell has a slope of 0 (not significant) (mean of 1.27 × 10⁻⁴ events/day/year, not significant). In accordance with the model, all locations have decreasing season length (mean of −9.8 days/decade, p‐value < 0.01), resulting in non‐significant slopes for break‐up events per year at all locations, except for Gambell (p‐value ≈ 0.08) and Sireniki (p‐value < 0.01) with negative slopes (mean across 6 locations of −0.006 events/year, not significant). In general, the number of events per year decreases significantly everywhere within the CESM1‐LE, whereas in satellite observations, the trends are generally not significant, with the exception of winter season length, which decreases in both model and satellite observations significantly.
Conclusions
The evolution of mid‐winter coastal ice break‐up events is an important factor to monitor for ensuring the safety of residents within coastal Arctic communities. An analysis of several Arctic communities with the CESM1‐LE shows that its sea ice component, despite not having a landfast ice parameter, reasonably simulates break‐up event magnitude and frequency. Moreover, in this analysis we demonstrate that these events are associated with synoptic‐scale sustained offshore wind, and that their frequency under climate change depends on the two opposing effects of decreasing winter length, and decreasing ice stability. We show that the magnitude of each effect is associated with the minimum winter season length, which is approximated by latitude. This analysis also reveals that some communities have already begun a transition to a new, less stable sea ice regime, where break‐up events are more frequent, and the winter season shorter. Model simulations indicate that most coastal Alaskan communities will pass through such a transition in the 21st century. The transition will not be easily predicted from local observations, and is likely to present increased risk for residents making their livelihood on the ice. We hope that understanding these trends can augment local and indigenous knowledge and improve people’s capacity to manage the risks.
Acknowledgements
This study is a contribution to NSF proposal number 1928126. We acknowledge the CESM Large Ensemble Community Project and supercomputing resources provided by NSF/CISL/Yellowstone23. We acknowledge the NOAA/NSIDC Climate Data Record of Passive Microwave Sea Ice Concentration provided by the National Snow and Ice Data Center19,22 was downloaded from the Copernicus Climate Change Service (C3S) Climate Data Store. The results contain modified Copernicus Climate Change Service information 2021. Neither the European Commission nor ECMWF is responsible for any use that may be made of the Copernicus information or data it contains. S. A. acknowledges funding from the NSERC USRA bursary program.
References
- Larsen, J. N. & Fondahl, G. Arctic human development report: regional processes and global linkages (Nordic Council of Ministers, 2014).
- Arrigo, K. R. in Sea Ice: An Introduction to its Physics, Chemistry, Biology and Geology (eds Thomas, D. N. & Dieckmann, G. S.) 143–183 (Chichester : John Wiley & Sons, 2008).
- Nelson, R. K. Alaskan Eskimo Exploitation of the Sea Ice Environment (Arctic Aeromedical Laboratory, 1966).
- Comiso, J. C. Abrupt decline in the Arctic winter sea ice cover. Geophysical Research Letters 33 (Sept. 2006).
- Holland, M. M., Bitz, C. M. & Tremblay, B. Future abrupt reductions in the summer Arctic sea ice. Geophysical Research Letters 33 (2006).
- Stroeve, J. C. et al. The Arctic’s rapidly shrinking sea ice cover: a research synthesis. Climatic change 110, 1005–1027 (2012).
- Comiso, J. C. & Hall, D. K. Climate trends in the Arctic as observed from space. Wiley Interdisciplinary Reviews: Climate Change 5, 389–409 (2014).
- Serreze, M. C. & Stroeve, J. Arctic sea ice trends, variability and implications for seasonal ice forecasting. Philosophical Transactions of the Royal Society A: Mathematical, Physical and Engineering Sciences 373, 20140159 (2015).
- Mioduszewski, J. R., Vavrus, S., Wang, M., Holland, M. & Landrum, L. Past and future interannual variability in Arctic sea ice in coupled climate models. The Cryosphere 13, 113–124 (2019).
- Druckenmiller, M. L., Eicken, H., Johnson, M. A., Pringle, D. J. & Williams, C. C. Toward an integrated coastal sea‐ice observatory: System components and a case study at Barrow, Alaska. Cold Regions Science and Technology 56, 61–72 (2009).
- Dyke, A. S., England, J., Reimnitz, E. & Jetté, H. Changes in driftwood delivery to the Canadian Arctic Archipelago: The hypothesis of postglacial oscillations of the Transpolar Drift. Arctic, 1–16 (1997).
- Mahoney, A., Eicken, H., Gaylord, A. G. & Shapiro, L. Alaska landfast sea ice: Links with bathymetry and atmospheric circulation. Journal of Geophysical Research 112 (2007).
- Jones, J. et al. Landfast sea ice breakouts: Stabilizing ice features, oceanic and atmospheric forcing at Barrow, Alaska. Continental Shelf Research 126, 50–63 (Sept. 2016).
- John, C. et al. Observations on shorefast ice dynamics in Arctic Alaska and the responses of the Iñupiat hunting community. Arctic, 363–374 (2004).
- Loewen, A. Landfast Sea Ice Break‐up Processes in Admiralty Inlet, NU PhD thesis (Carleton University, 2020).
- Antonova, S. Spatial and temporal variability of landfast ice in the Laptev Sea PhD thesis (Alfred Wegener Institute, 2012).
- Laliberté, F., Howell, S. E., Lemieux, J.‐F., Dupont, F. & Lei, J. What historical landfast ice observations tell us about projected ice conditions in Arctic archipelagoes and marginal seas under anthropogenic forcing. The Cryosphere 12, 3577–3588 (2018).
- Howell, S. E., Laliberté, F., Kwok, R., Derksen, C. & King, J. Landfast ice thickness in the Canadian Arctic Archipelago from observations and models. The Cryosphere 10, 1463–1475 (2016).
- Meier, W., Fetterer, F., Windagel, A. K. & Stewart, J. S. NOAA/NSIDC Climate Data Record of Passive Microwave Sea Ice Concentration, Version 4. NSIDC: National Snow and Ice Data Center (2021).
- Cavalieri, D. J., Gloersen, P. & Campbell, W. J. Determination of sea ice parameters with the Nimbus 7 SMMR. Journal of Geophysical Research: Atmospheres 89, 5355–5369 (1984).
- Comiso, J. C. Characteristics of Arctic winter sea ice from satellite multispectral microwave observations. Journal of Geophysical Research: Oceans 91, 975–994 (1986).
- Hersbach, H. et al. ERA5 hourly data on single levels from 1979 to present. Copernicus Climate Change Service (C3S) Climate Data Store (CDS) (2018).
- Kay, J. E. et al. The Community Earth System Model (CESM) Large Ensemble Project: A Community Re‐ source for Studying Climate Change in the Presence of Internal Climate Variability. Bulletin of the American Meteorological Society 96, 1333–1349 (2015).
- Mahoney, A. R., Eicken, H., Gaylord, A. G. & Gens, R. Landfast sea ice extent in the Chukchi and Beaufort Seas: The annual cycle and decadal variability. Cold Regions Science and Technology 103, 41–56 (2014).
- Riahi, K. et al. RCP 8.5—A scenario of comparatively high greenhouse gas emissions. Climatic change 109, 33–57 (2011).
- Lemieux, J.‐F. et al. A basal stress parameterization for modeling landfast ice. Journal of Geophysical Research: Oceans 120, 3157–3173 (2015).
- Bennartz, R. On the use of SSM/I measurements in coastal regions. Journal of atmospheric and oceanic technology 16, 417–431 (1999).
- Gualtieri, G. Reliability of ERA5 Reanalysis Data for Wind Resource Assessment: A Comparison against Tall Towers. Energies 14, 4169 (2021).
- Molina, M. O., Gutiérrez, C. & Sánchez, E. Comparison of ERA5 surface wind speed climatologies over Europe with observations from the HadISD dataset. International Journal of Climatology 41, 4864–4878 (2021).
- Jiang, Y. et al. Evaluation of HRCLDAS and ERA5 Datasets for Near‐Surface Wind over Hainan Island and South China Sea. Atmosphere 12, 766 (2021).
- Meier, W. N. et al. Arctic sea ice in transformation: A review of recent observed changes and impacts on biology and human activity. Reviews of Geophysics 52, 185–217 (2014).
Aucoin, Tremblay, & Newton. MSURJ, 17, 1, 18-22 (2022)